
“Is better copy really worth paying for?” Every agency hears it, usually right before the client picks the cheapest option.
The honest answer is “it depends.” But that answer doesn’t win projects. The math behind it is simple, and once a client sees it with their own numbers, the question mostly answers itself.
The math, with example numbers
Take a service business whose main page gets 2,000 visitors a month and turns 2% of them into leads. One in four leads becomes a client, and a client is worth $1,500.
Now say better copy makes that page convert 20% better.
| Before | After (20% better) | |
|---|---|---|
| Visitors per month | 2,000 | 2,000 |
| Conversion rate | 2.0% | 2.4% |
| Leads per month | 40 | 48 |
| New clients per month (1 in 4 leads) | 10 | 12 |
| Revenue from new clients per month | $15,000 | $18,000 |
That’s 2 more clients and $3,000 more a month, or $36,000 a year, from the same traffic. No extra ad spend, no new hires.
These are example numbers, not a promise. Put in your client’s own: monthly visitors, conversion rate, how many leads become clients, and what a client is worth. The point is the shape of the math: small percentage gains on a page that already gets traffic add up to real money.
“20% better” can mean two different things
Going from 2.0% to 2.4% is 20% better. It’s also only 0.4 percentage points. Both are true, and they sound very different.
When someone promises “20% more conversions,” ask which one they mean. A jump from 2% to 22% would be twenty points, and nobody should promise that.
A better score isn’t a better result (yet)
A copy score tells you which version is stronger. It doesn’t tell you how much money the stronger version will make.
In one CopyZap run, the original page scored 51 and the best new version scored 78: 27 points, or 53%, higher. That’s a big gap in quality. It is not 53% more sales. How much a better page earns also depends on the offer, the price, the design, the traffic and the timing.
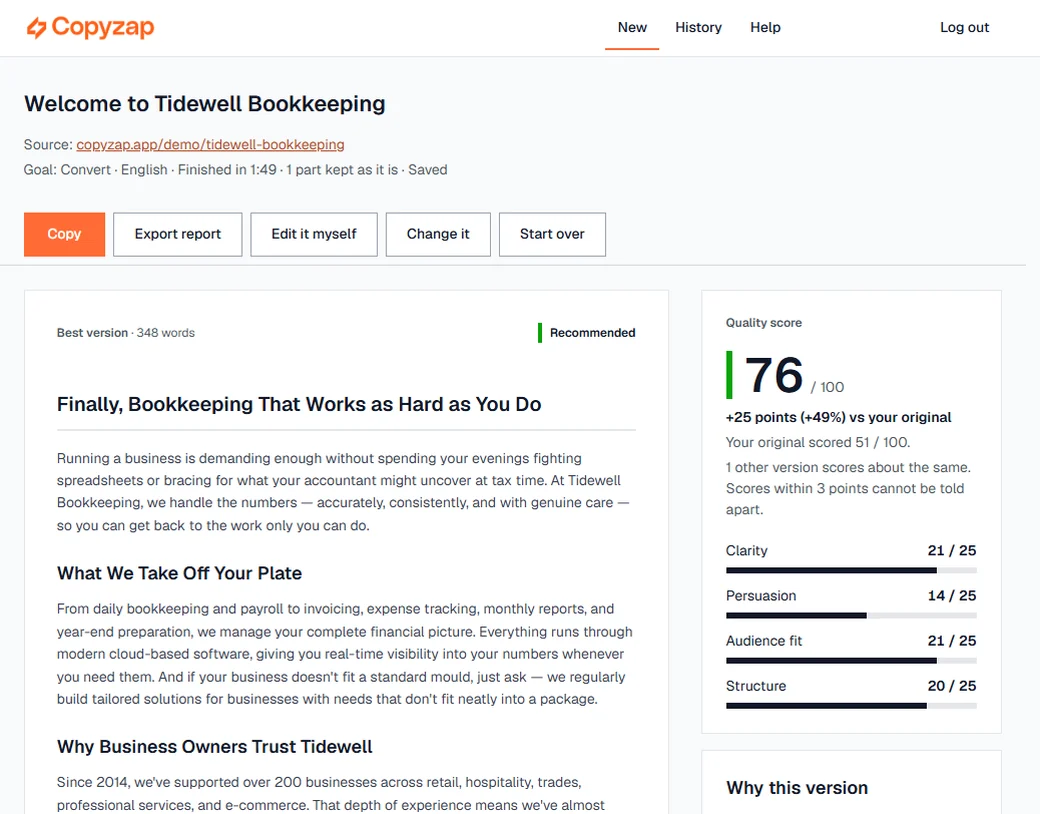
So use the score to decide what to publish. Use real visitors to find out what it was worth. (How the score works.)
How to check whether the lift is real
Run an A/B test, if the page gets enough traffic. Most don’t. To reliably detect a 20% lift on a page converting at 2%, you need about 21,000 visitors per version, at the usual settings (95% confidence, 80% power). A page with 2,000 visitors a month would need almost two years. You can check the numbers for any page with a free sample size calculator.
Compare before and after, if it doesn’t. Measure four weeks before the change and four weeks after, in a similar season, without changing anything else at the same time (ads, prices, design). It isn’t proof, but it’s honest evidence.
Test where the volume is. Email subject lines and ads get far more views than most pages, so they show a difference much faster.
Don’t celebrate noise. A conversion rate moving from 2.0% to 2.1% over a few hundred visitors means nothing. The same goes for scores: when two versions are within 3 points, CopyZap says they score “about the same.”
How to use this with clients
- In the proposal, fill in the table with the client’s own numbers. Show what 10% or 20% better would be worth, not a promise that it will happen.
- Promise the process, not a percentage. “We write, score and compare versions, and we measure the result” is a promise you can keep.
- In the report, show the before-and-after score now and the real numbers after four to eight weeks. That second report is what gets you the next project.
For how to present the winning version itself, see Stop sending clients “here are 3 options”.
Where CopyZap fits
CopyZap handles the first half: it writes three new versions, scores them and your original on the same scale, and shows how far the best one is ahead. Export the report and you have the before-and-after score in a file you can send to the client.
The second half, real visitors and real results, is where your client’s numbers come in.